DATA / WEBSITE VISUALIZATION Samples
BURIAL PLOTS: CHAPTER II - Political leaders & Conquests (Wikipedia.org)

Summer 2020 - HTML / CSS / JS / D3.JS v4 — (Optimized for Chrome / Edge / Brave)
Uncover the grim history of political conflicts and the leaders that wrought the damage with this interactive barchart dashboard
All data and images sourced from Wikipedia.org
BURIAL PLOTS: CHAPTER I - war & conflicts (100K+) (Wikipedia.org)

Summer 2020 - HTML / CSS / JS / D3.JS v4 — (Optimized for Chrome / Edge / Brave)
Compare the cost of human conflicts throughout history with this interactive bubblechart dashboard
All data and images sourced from Wikipedia.org
LEAFLY.com’S Mood-driven STRAIN SELECTOR
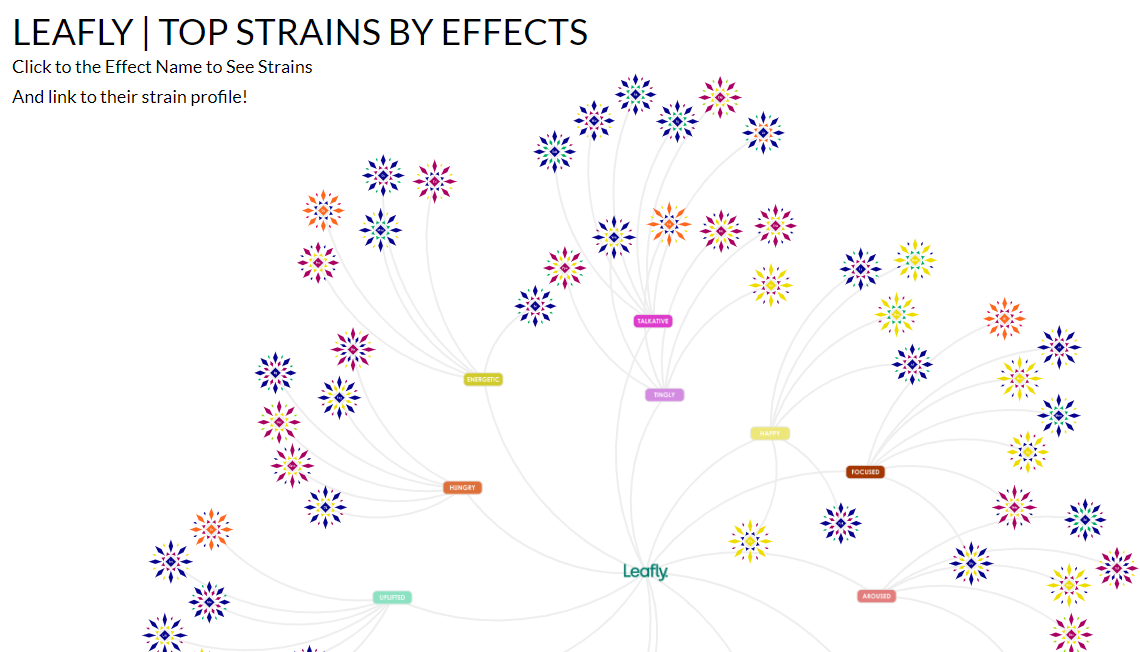
Summer 2020 - HTML / CSS / JS / D3.JS v3 — (Optimized for Chrome / Edge / Brave)
In 2019, Leafly re-designed their website and created unique terpene profiles as SVG for each strain in their database — but received mixed acceptance from the community
This interactive visualization encourages users to click through their catalog by mood and compare these intricate terpene profiles by representing them more like the product itself — a flower
EXPLORING PALMISTRY with psychiclibrary.com

Summer 2020 - HTML / CSS / JS / Adobe Illustrator / D3.JS v4 - (Optimized for Chrome / Edge / Brave)
What secrets do your palms hold?
Explore the lore and superstition of your palm lines and mounds click-by-click in this colorful recreation of PsychicLibrary.com’s Palm Reading Room
Careful though! It can be addictive . . .